Why a trade journal changes outcomes
A journal turns a vague sense of how trading is going into evidence you can act on. What to record, how to review by setup and by time of day, what best and worst days tell you, and why the notes have to be honest.
Most traders believe they know how their trading is going. Ask them which setup made the money last quarter, which hour of the day cost the most, and how many of their losing trades broke a rule they had already written down, and the answers get vague. Memory is a poor record of trading. It keeps the dramatic trades and forgets the ordinary ones, and it is kinder to us than the numbers are.
A journal replaces memory with evidence. It changes outcomes not by itself but by changing what you decide to do next, because the decision is now based on what actually happened. This post covers what to record, how to review it, and the one requirement that makes the whole thing work.
What to record
The minimum is what the broker already knows: instrument, side, quantity, entry and exit prices and times, and the result after costs. That is enough for the arithmetic, and if it is captured automatically you will never fall behind.
The useful part is what the broker does not know.
The setup. Which rule or pattern the trade belonged to. A short label is enough: "EMA cross", "opening range", "mentor call", "no setup". The last one is the most important label in the journal.
The plan at entry. Where the stop and target were when you entered, and the size you intended. Without this you cannot tell a trade that went to plan from one that happened to work.
What you did during the trade. Moved the stop, added, took partial profit, closed early, held past the plan. One line.
The state you were in. Rested or tired, calm or chasing, first trade of the day or fifth. This feels unscientific and turns out to be one of the strongest patterns most people find.
A screenshot of the chart at entry and, if possible, at exit. A month later it answers questions the numbers cannot.
A mistake tag when there was one. "Entered early", "no stop", "revenge trade", "ignored the time filter". A fixed list of a dozen tags is better than free text, because it can be counted.
For automated strategies the plan is the rule itself, so the journal's job shifts to recording what the rule did and whether you intervened. Every manual override of an automated system deserves its own tag.
Reviewing by setup
Once trades carry a setup label, the first review is simple: group by setup and look at the result of each group over enough trades. This almost always produces a surprise. A setup you think of as your best is often middling, propped up by one memorable win, and a dull setup you barely notice is quietly carrying the account. The review tells you which rules deserve more size and attention and which deserve retirement or rework.
Look at more than the total. For each setup, look at the average win against the average loss, the longest losing run, and how often the plan was followed. A setup with a reasonable result and a poor plan-adherence rate is two different setups mixed together, and separating them is usually the most valuable edit you can make.
Reviewing by time of day and day of week
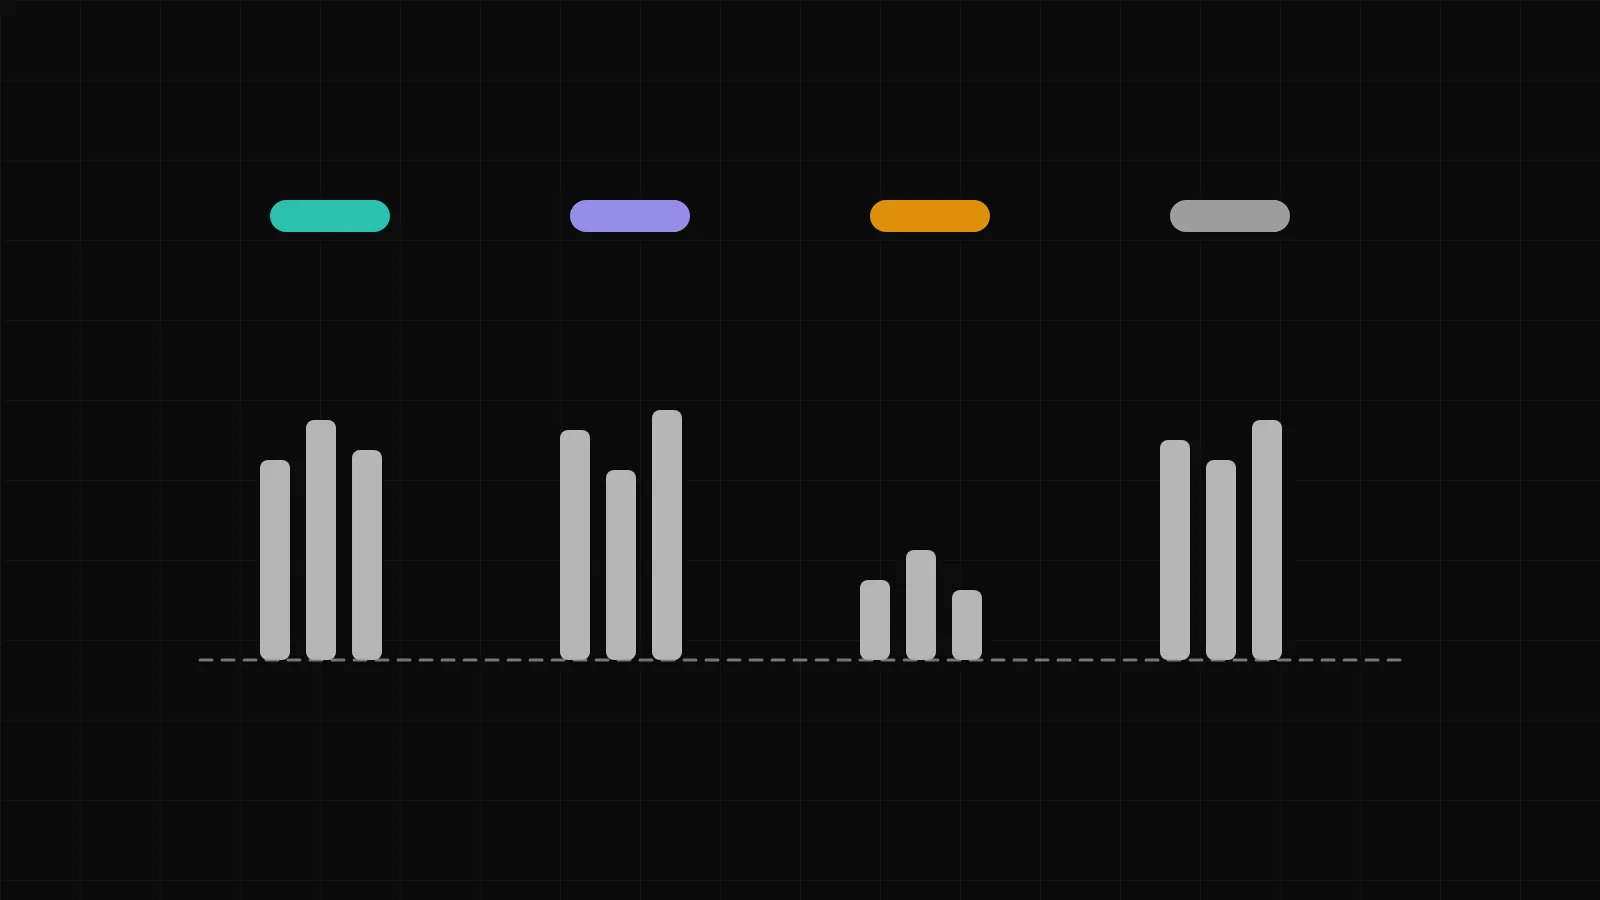
The same trade taken at 09:20 and at 14:30 is not the same trade. The open is faster and more expensive to trade; the middle of the day is quieter; the hour before the close has its own character; and an MCX evening is a different market again. Grouping results by hour of entry shows where a setup works and where you are paying to find out that it does not.
Day of week is worth a look too, not because weekdays have magic but because the calendar does: expiry days, days with scheduled announcements, Mondays after a weekend gap. If a pattern appears, resist the urge to act on it after two weeks. Patterns in small samples are mostly noise. Note it, keep collecting, and act when it persists.
What best and worst days tell you
Sort days by result and look at both ends. The best days usually have something in common, and it is often not what you expect: a particular setup, a particular hour, or simply fewer trades. The worst days are more instructive. In most journals the worst days contain a disproportionate number of trades, a disproportionate number of mistake tags, and at least one trade whose label is "no setup". The damage is rarely one bad trade; it is a sequence that started with one and continued because nothing stopped it.
That observation leads directly to two rules worth having: a daily loss limit, and a maximum number of trades per day. Both are easier to set when the journal shows exactly which days would have been cut short, and by how much.
Look also at streaks. How long was the longest losing run, and how did you behave during it? If size went up, that is the most expensive habit in the journal, and the easiest to see once it is written down.
Honest notes
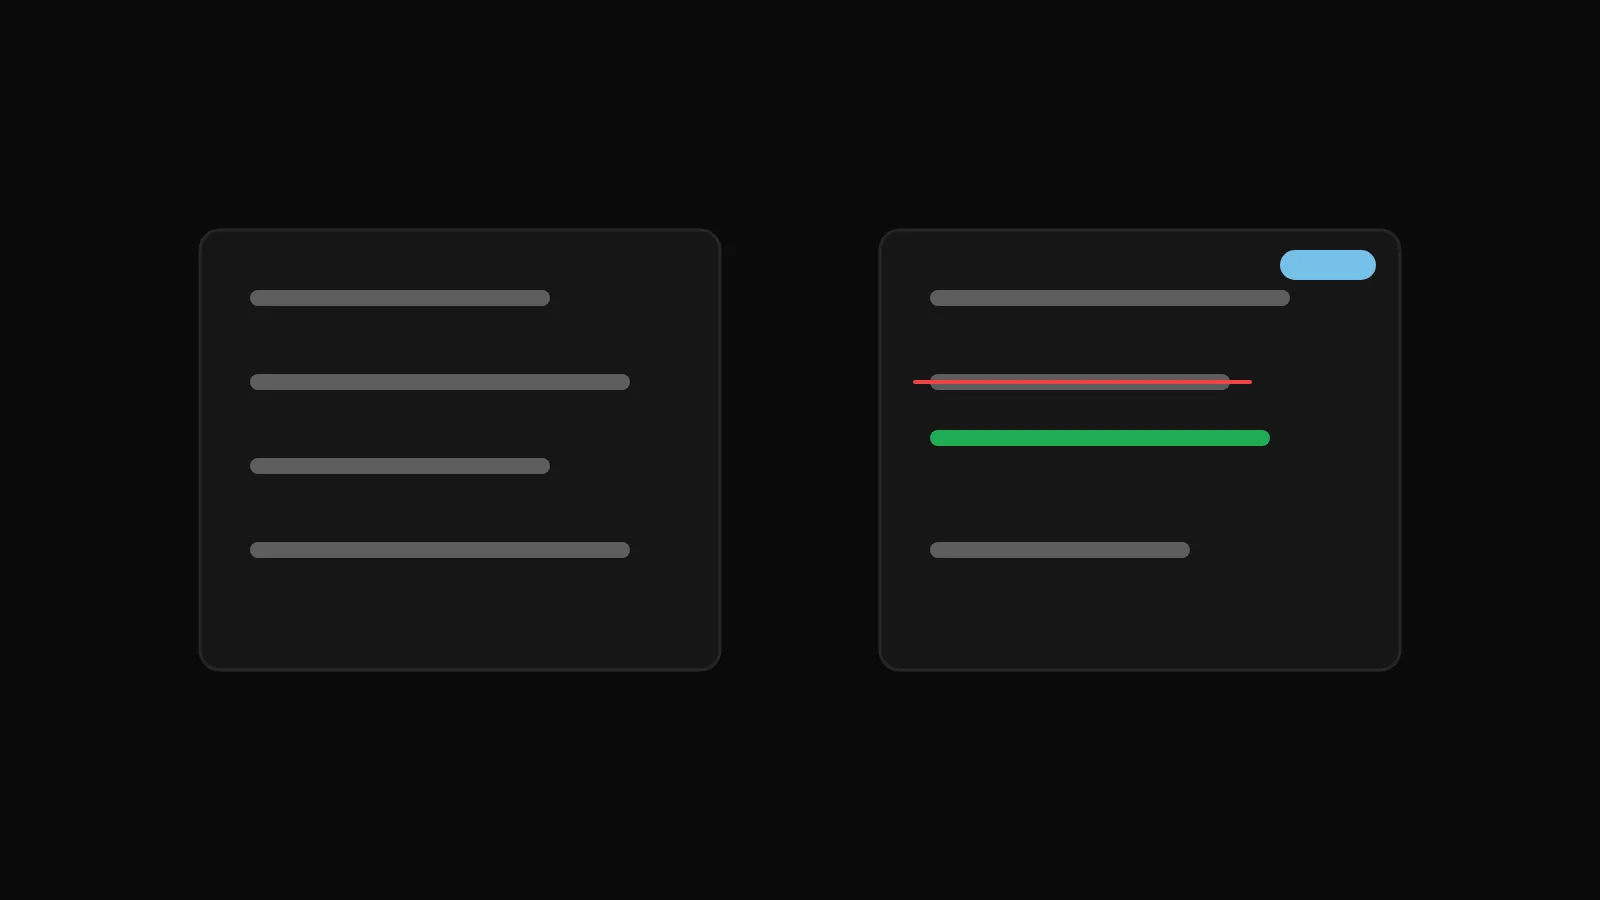
A journal only works if the notes are true, and the temptation to make them flattering is constant. "Market was choppy" is a comfortable note; "entered before the candle closed because I was impatient" is an accurate one. Only the second can change anything.
Three habits help. Write the note the same day, before the result has had time to colour it. Write the note for a loss with the same care as for a win, and for a win that broke a rule with the same tag as a loss that did. And review on a fixed schedule, weekly or monthly, when you are not trading, so that the review is a calm reading of evidence rather than a reaction to the last trade.
An honest journal is sometimes uncomfortable to read. That discomfort is the sign it is doing its job. The alternative is a comfortable record that confirms what you already believed and leaves the outcomes exactly where they were.
How DalRoti helps
The DalRoti Journal logs closed trades automatically from every connected account, with broker and MT5 history imported after connection and synced daily, and accepts broker tradebook files by CSV or XLSX for accounts you have not connected. Each trade can carry notes, tags, mistake tags, a rating and screenshots. Filters cover account, period, net or gross, INR or USD, and asset class.
The Overview shows the figures discussed above: win rate, average win and loss, expectancy, drawdown, best and worst day, largest win and loss, average holding time, and winning and losing streaks, with an equity curve and daily results. A Calendar view shows each day's result with weekly totals, and Reports break results down by symbol, side, hour and weekday, which is the setup-and-time review without a spreadsheet. For automated strategies, the Monitor page's execution log records why each trade happened. The journal can be exported as CSV on paid plans.
Trading involves a high risk of loss. DalRoti is a software tool and does not guarantee any profit. Decide your own risk and position size.
AI Generated