The strategy builder and backtesting, from first block to first result
How DalRoti's no-code strategy builder works, from templates and indicator conditions to position sizing, time windows and candle-close checks, then how to run a backtest, read the results and understand why backtest and live differ.
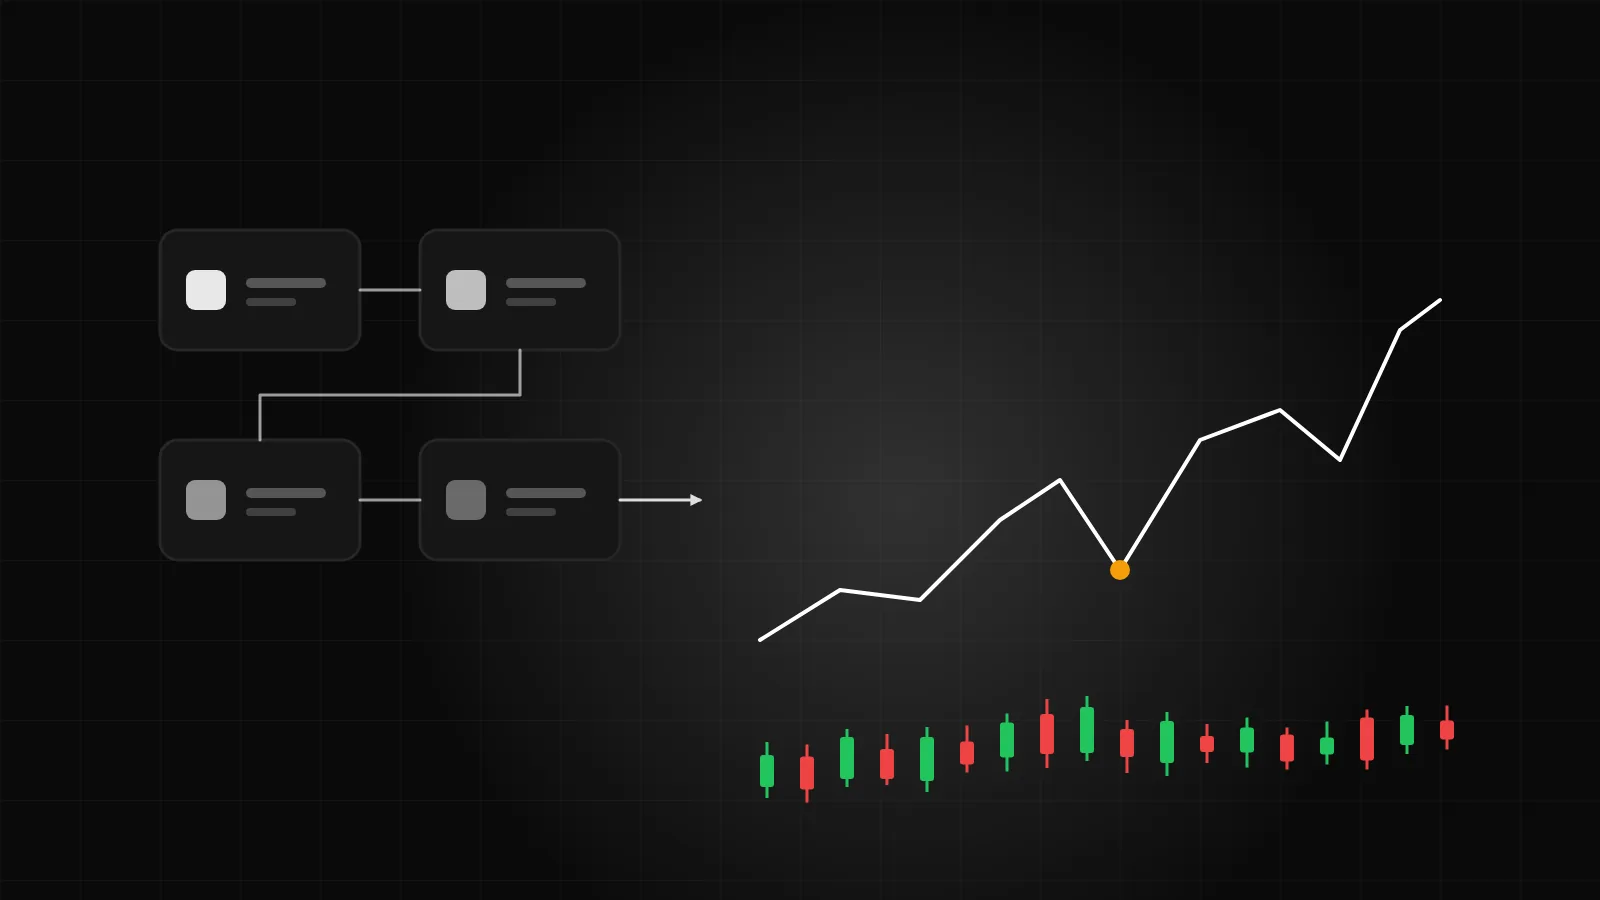
Automation on DalRoti does not need code. A strategy is assembled from blocks: a symbol and interval, conditions on indicators, rules for when entries are allowed, a sizing rule, and stop-loss and take-profit settings. The same engine then backtests it on stored history, paper-trades it at live prices and, on paid plans, runs it on your connected broker account.
This post walks through the builder step by step and then through a backtest, with the honest caveat at the end about why a backtest is not a prediction.
Starting from a template
Open Automation in the left rail. New strategy starts a blank form; Start from a template fills it with a working example. The templates include an EMA 9/21 cross on XAUUSD 15M, a Supertrend(10,3) flip on a one-hour chart, an RSI mean-reversion on a five-minute Indian stock, a previous-candle breakout on EURUSD during the London and New York sessions, and a London open drive that enters immediately within a short time window. Nothing is saved until you press Save, so a template is a safe way to see how a complete strategy is laid out.
The header shows the strategy's status as you work: DRAFT, NEEDS FIXES, READY or BACKTESTED. A Live summary on the right restates the rules in plain words as you change them, which is the quickest check that the strategy says what you meant.
Symbols, conditions and timeframes
Symbols takes one symbol per strategy and an interval. An index such as NIFTY 50 cannot be traded itself, so the builder offers Trade via a future or an option, with the strike offset and expiry you choose, and shows the contract it would pick right now.
Logic is where the conditions live. Each condition is a compact card: an indicator with its period and source, a comparison such as higher than, lower than, crosses above or crosses below, a second indicator, price or number, and a timeframe. The indicator list covers EMA, SMA, RSI, Supertrend, VWAP and many more. The timeframe on a condition can differ from the strategy interval, so a 15-minute entry can require a one-hour trend to agree.
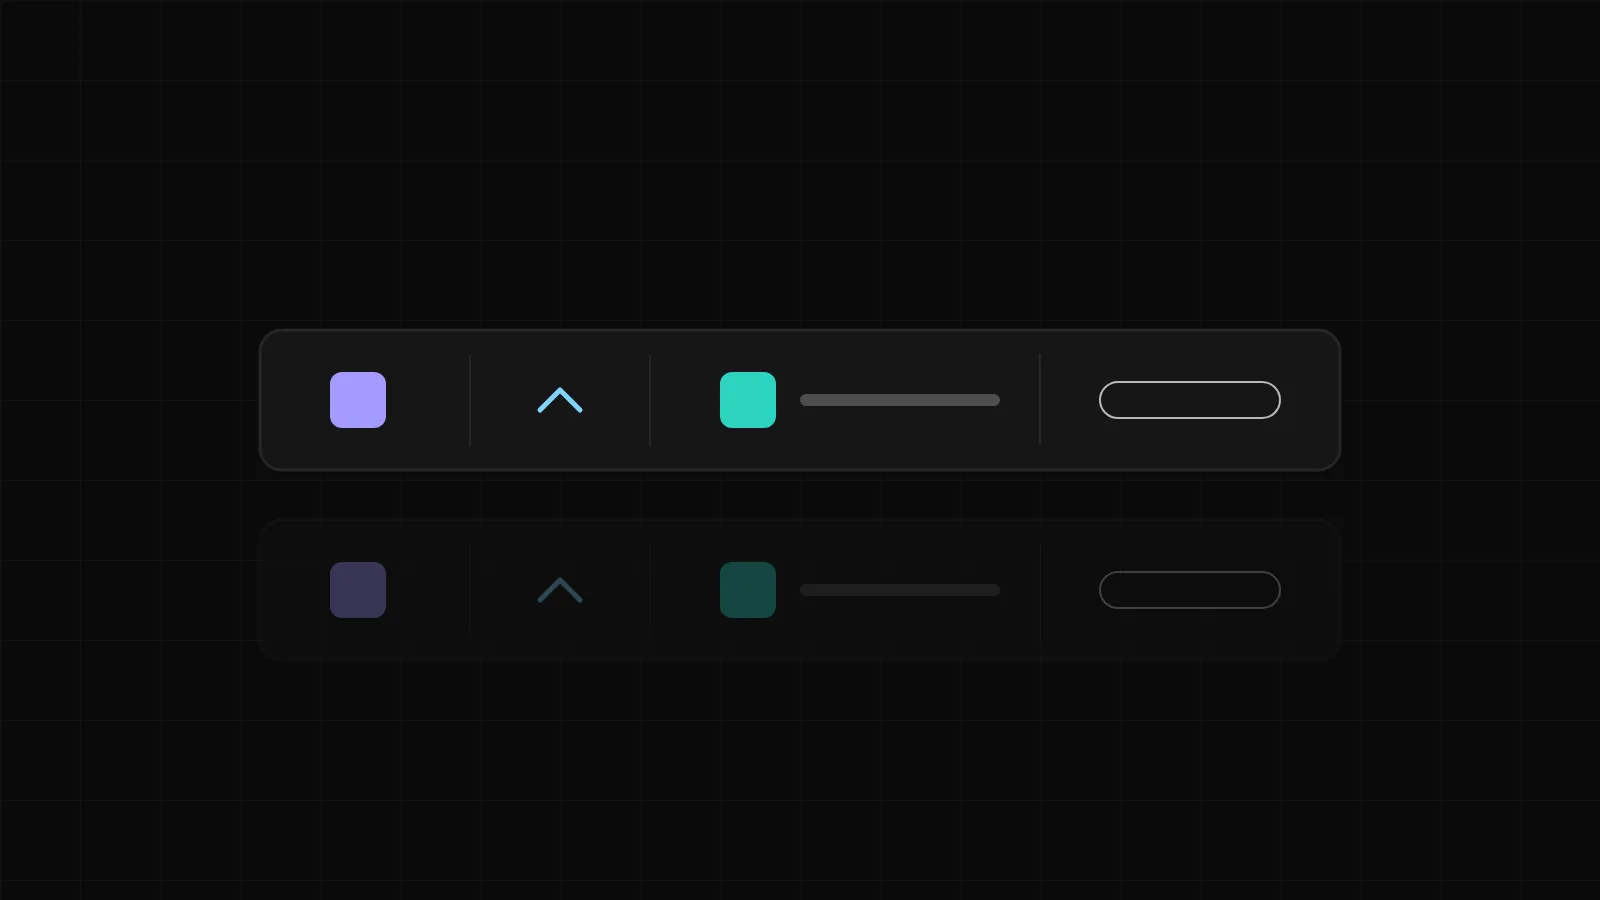
An Offset on a condition counts candles back from the current one, with zero meaning the live candle. Conditions can also be checked on other symbols' candles while the trade stays on your symbol. Direction is long only, short only, or long and short with the conditions mirrored for shorts; pyramiding and close-and-reverse are options.
Entry windows and order limits
Entry controls when the strategy is allowed to act. An entry time range in exchange time, the days of the week, and session presets for Asia, London and New York in UTC. Then the limits: a maximum number of orders in total and per day, a minimum gap between entries, one trade per signal, and whether to re-enter the same day after a stop-loss or take-profit.
Exit adds optional close conditions and time exits: after a number of minutes or candles, at a time of day, or a set number of minutes before the 15:30 IST close for Indian symbols.
Checks on candle close
By default a strategy checks its conditions when a candle closes. This is deliberate: a condition that is true half-way through a candle and false at its close has not happened, and checking on close keeps backtest, paper and live consistent with each other. Checking on every tick is available on some paid plans for strategies that need it, with the number of every-tick strategies limited per plan.
Sizing and risk
Size and risk sets how much each trade is. The sizing modes are a fixed lot, a percentage of balance, a percentage of equity, a fixed risk amount, or lot from stop-loss distance, which divides the amount you are willing to risk by the distance to the stop so the money at risk stays constant across trades. Stop-loss and take-profit can be set as points, a percentage, a multiple of ATR, a risk-to-reward ratio, the previous candle or an indicator, with optional trailing and break-even. Orders can be split into equal parts with their own targets.
Stop-loss and take-profit protection is either Broker orders, held at the broker, or DalRoti managed, watched by the platform; futures and options use DalRoti managed. Execution chooses the account (DalRoti Paper or a connected broker), market or limit orders, the product type for Indian symbols, and whether to place orders at all or run as signals only.
Versions
Review shows a summary and a validation list with a Fix link for every problem, then asks what changed and saves a version. Versions are immutable: a backtest, a paper run and a live run each point at one version, and editing afterwards never changes a running one. The Versions list lets you view, compare or restore any earlier one.
Running a backtest
The Backtest step replays up to a year of stored 1-minute history, built to the strategy's timeframe, through the same engine that runs paper and live. You set the period, starting capital and leverage, press Run backtest and can leave the page; a notification arrives when it finishes. When a strategy trades via a future or option, each trade is priced on that contract's own history, and a contract with no history is named and left out rather than estimated from the index.
Each plan includes a daily backtest allowance. A result that changes when re-run usually means history was still downloading the first time; the second run is the one to trust.
Reading the results
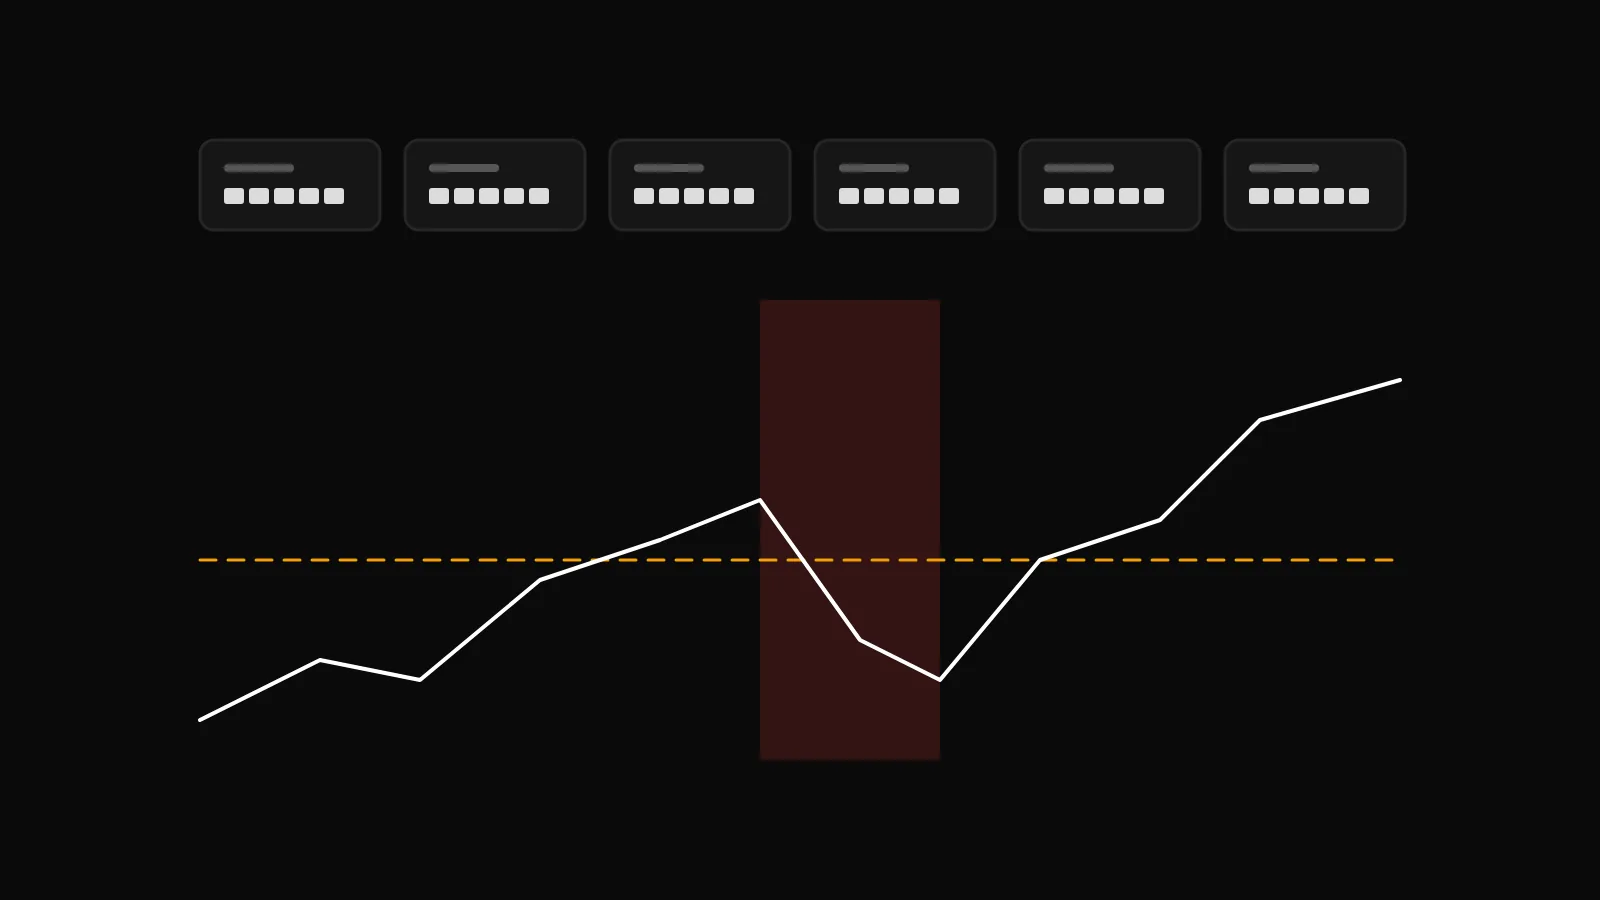
The results page has a header of figures: net profit, number of trades with wins and losses, win rate, profit factor, maximum drawdown, Sharpe, final balance and gross profit and loss. Below it, the price chart with entry and exit markers, the equity curve, a margin level chart, and the trade list with each trade's reason for exit and its R multiple.
Read them in this order: the equity curve for shape, the drawdown for whether you could have sat through it, the trade count for whether there is enough evidence, and only then the net figure. Fewer than about 30 trades is noise. A drawdown you would not tolerate with real money is a rejection whatever the final balance says.
Then read How this backtest was simulated. It states the tick coverage, the spread mode, the margin and contract maths, the fill timing, how a stop and target inside the same candle were resolved, and how gaps and indicator warm-up were handled. Two finished runs can be ticked and compared side by side.
Why backtest and live differ
A backtest fills at bar prices from stored history. Paper and live fill on the real bid and ask after the candle closes, pay the real spread and are subject to slippage, broker acceptance and connectivity. A backtest with the spread switched off and zero slippage will look better than the same rules live; setting a broker spread and a point or two of slippage brings it closer. Broker accounts backtest on that broker's history, while DalRoti Paper uses the platform's own history, which is one more reason to backtest on the account you intend to use.
The Monitor page measures the gap directly with a Paper vs Backtest signal match and lists every mismatch with a reason. A backtest is evidence about the past under stated assumptions. It is not a forecast, and we do not present it as one.
Backtesting and paper strategies are available from the free plan; live strategies run on paid plans. Details are at dalroti.ae/#pricing.
Trading involves a high risk of loss. DalRoti is a software tool and does not guarantee any profit. Decide your own risk and position size.
AI Generated