Indicators used systematically, with EMA, Supertrend and RSI as examples
An indicator is only useful in a system once it is written as a rule with a defined comparison. How to turn EMA, Supertrend and RSI into rules, choose parameters without fooling yourself, confirm across timeframes, and avoid stacking.
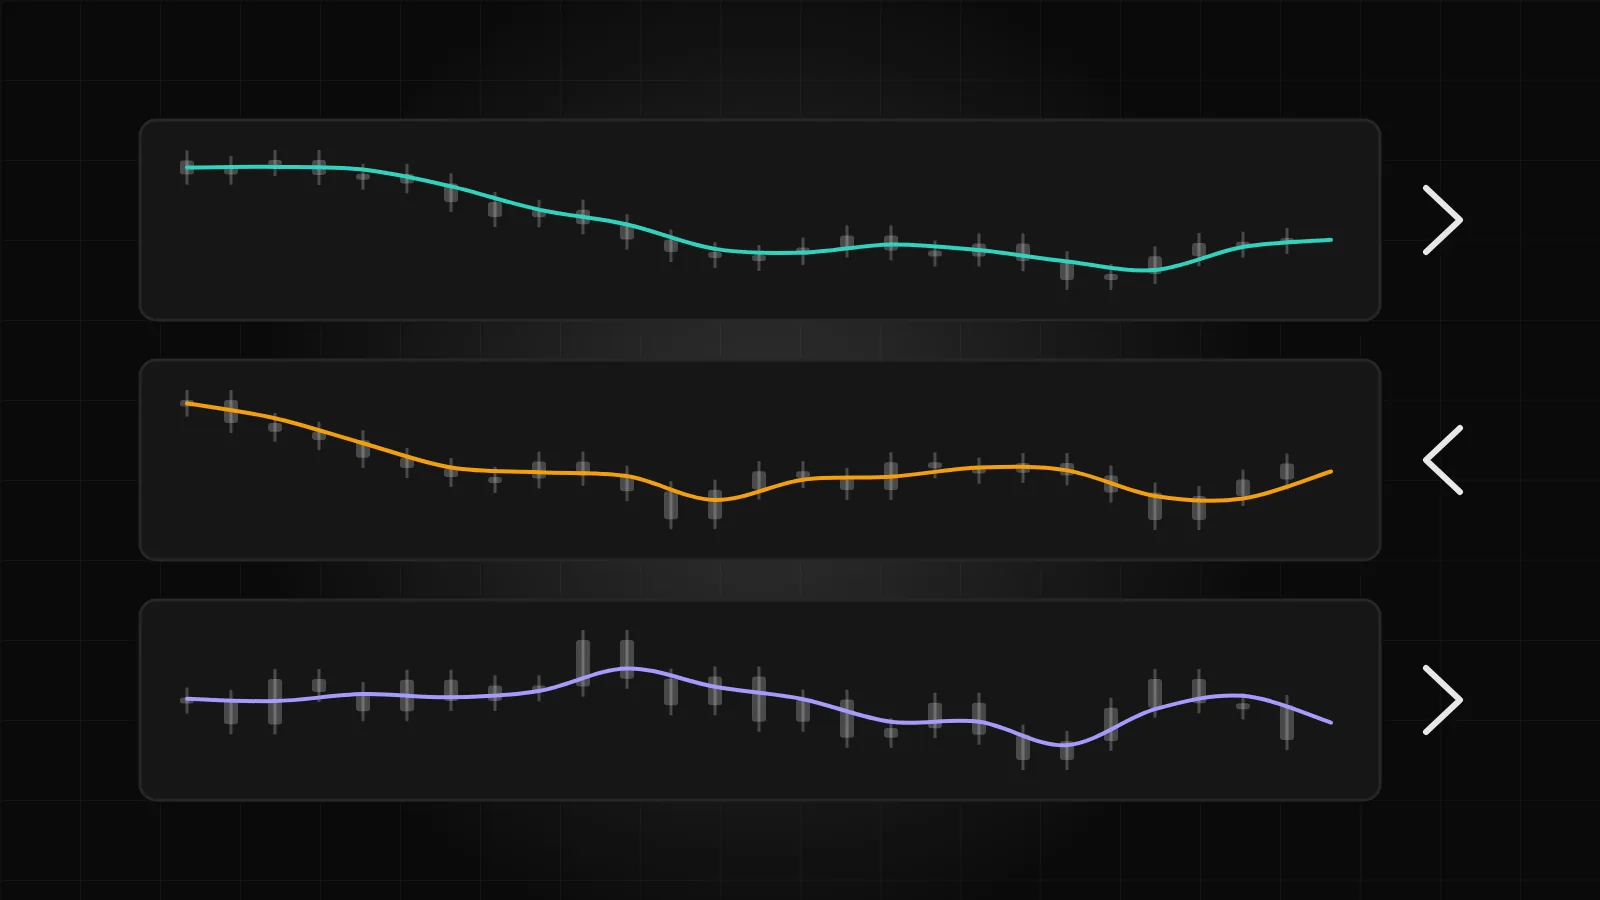
Most charts carry indicators, and most of them are used as opinions. A moving average "looks supportive", an RSI "looks stretched", a Supertrend "has flipped". Those readings may be sound, but they are not rules: two people looking at the same screen can disagree, and the same person can read it differently after a loss. An indicator earns a place in a system when it is written as a comparison that is either true or false on every candle. This post shows how to do that for three common indicators, how to choose their parameters without deceiving yourself, how to use more than one timeframe, and why adding indicators usually makes a rule worse.
Three indicators as rules
EMA. An exponential moving average is a smoothed price that weights recent candles more heavily. On its own it is a line; as a rule it needs a comparison. The usual forms are: price closes above the EMA (trend filter); a faster EMA crosses above a slower one (trend change signal); the EMA is rising, meaning its current value is above its value a few candles ago (direction filter). "EMA(9) crosses above EMA(21) on the 15-minute chart" is a rule. "The EMAs look bullish" is not.
Supertrend. Supertrend draws a line that sits below price in an uptrend and above it in a downtrend, placed at a multiple of the average true range from the candle midpoint. It has two parameters: the ATR period and the multiplier. It changes side when price closes through it, which gives it a natural rule form: close crosses above Supertrend (long signal), close crosses below (short or exit). Because it flips on a close, it is already close to a rule; the work is deciding whether a flip is a signal, an exit, or both.
RSI. The relative strength index measures recent gains against recent losses on a scale from 0 to 100. As an opinion it is "overbought" or "oversold"; as a rule it is a threshold or a crossing: RSI(14) crosses back above 30; RSI(14) is above 50; RSI crosses its own moving average. Note that two rules with the same indicator can point in opposite directions. "RSI above 70" can be a filter for strength in a trend-following rule or a trigger for fading in a mean-reversion rule. The indicator does not decide which; you do, and you must decide before testing.
In every case the rule has four pieces: the indicator and its parameters, the source it is calculated on (usually close), the comparison, and the timeframe. Write all four down. Also write down the offset: whether the comparison is made on the candle that just closed or on an earlier one. A rule evaluated on the live, unfinished candle will fire and un-fire within the candle; a rule evaluated on close fires once.
Choosing parameters honestly
Every indicator has parameters, and every parameter is a temptation. Run the rule with EMA lengths 8 and 21, then 9 and 21, then 10 and 20, and keep the best, and you have fitted the rule to the test period rather than to anything that will repeat.
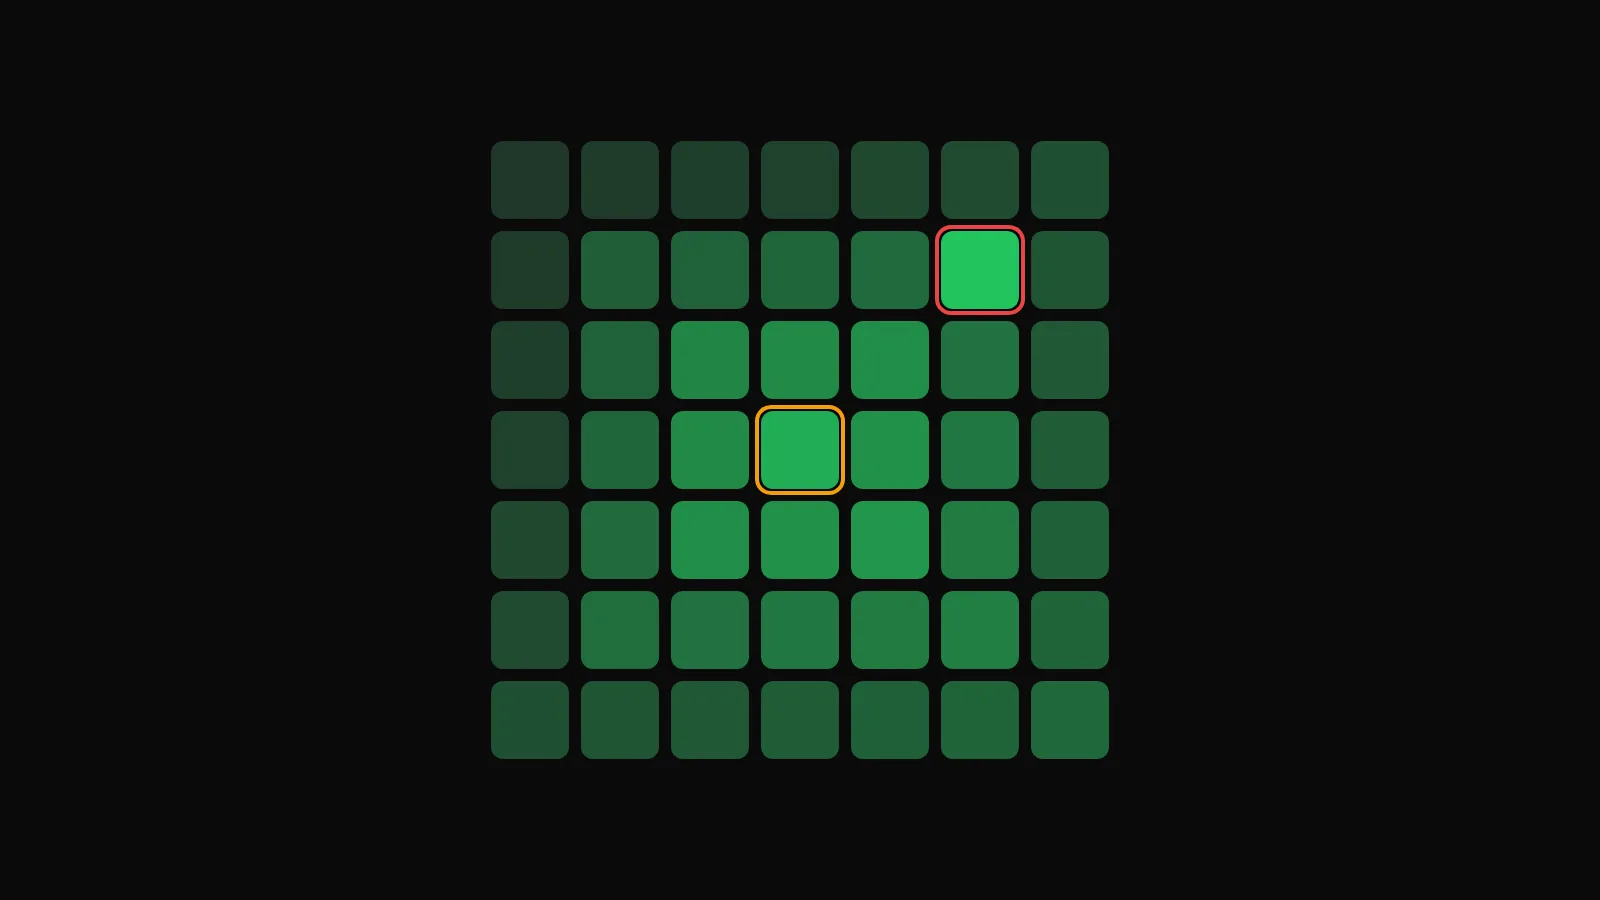
A better approach has three parts. Start from a conventional setting (EMA 9 and 21, Supertrend 10 and 3, RSI 14 are common for good reason: they are widely used and nobody chose them for your data). Test a neighbourhood of settings around it rather than a single point, and prefer a region where results are similar to a single setting that stands out from its neighbours. And decide the parameters on one stretch of data and confirm them on another that was not used for choosing.
Parameters also have a meaning that is worth respecting. A longer EMA responds more slowly and gives fewer, later signals; a larger Supertrend multiplier sits further from price and flips less often; a shorter RSI period swings more widely. If a parameter change improves the test for a reason you cannot explain in those terms, be suspicious of it.
Confirming across timeframes
A common structure uses two timeframes: a higher one for direction and a lower one for timing. For example, only take long signals on the 15-minute chart when the 1-hour close is above the 1-hour EMA(50). The higher timeframe condition is a filter; the lower timeframe condition is the trigger.
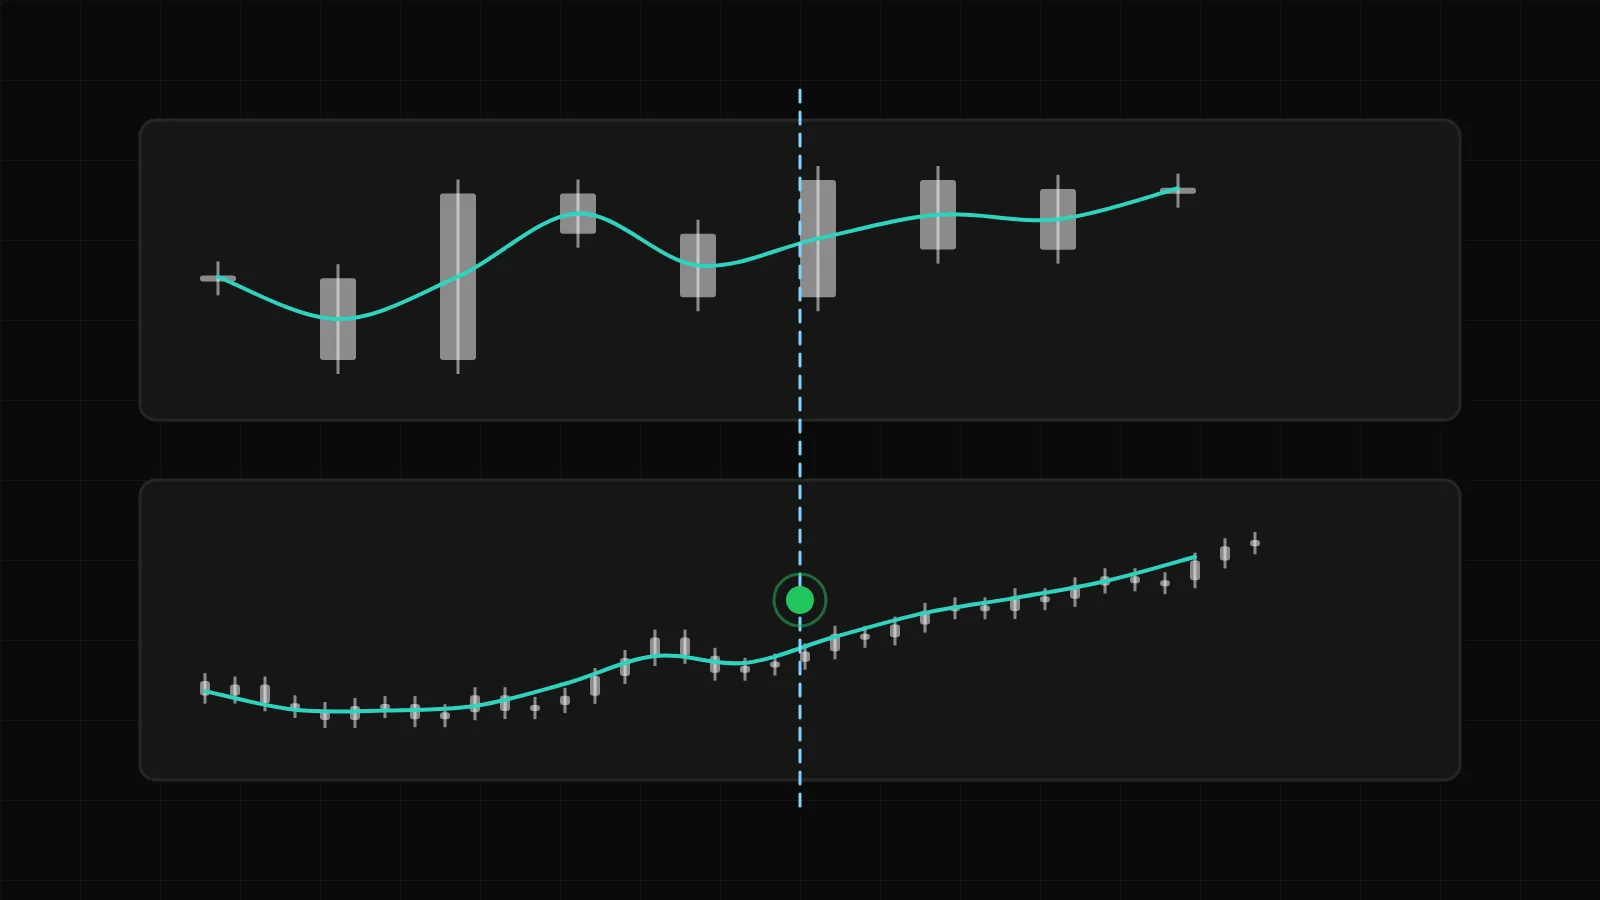
Two cautions. First, be precise about which higher-timeframe candle the filter reads. The current 1-hour candle is not finished while the 15-minute candles inside it close, so a filter that reads it is reading a value that can still change; reading the last completed 1-hour candle is the safe default. Second, a filter reduces the number of trades. That is often the point, but a rule that ends up with a handful of trades a month has lost most of its evidence, so check the trade count after adding any filter.
Avoiding indicator stacking
Stacking is adding indicators to a rule until it only fires when all of them agree: EMA cross, plus RSI above 50, plus Supertrend green, plus MACD positive, plus volume above average. Each addition seems to remove bad trades in the test. Together they create three problems.
They are correlated. EMA direction, Supertrend side and RSI above 50 are all measuring recent price direction in slightly different ways. Requiring all three is not three confirmations; it is one condition asked three times, with a later entry each time.
They overfit. Every added condition is a parameter set chosen on the same data, and a rule with five indicators and twelve parameters can be made to fit almost any period.
They hide the edge. When a stacked rule stops working, there is no way to tell which condition failed. A rule with one signal and one filter can be diagnosed; a rule with five cannot.
A reasonable limit is one signal, one filter and one exit. If you want more, make a second strategy and run both, so that each can be judged on its own.
How DalRoti helps
The DalRoti strategy builder is built around the rule form described here. Each condition is a card with an indicator and its period, source and offset, a comparison (is above, is below, crosses above, crosses below) against another indicator, a price or a number, and its own timeframe, so a 1-hour filter and a 15-minute trigger sit side by side in one rule. Conditions are checked on candle close by default; checking on every tick is available with limits by plan. EMA, SMA, RSI, Supertrend and VWAP are among the indicators offered.
A preview above the logic step draws recent candles with the condition's indicators and the buy, sell and exit markers the rule would have produced, and updates as you edit, so that the difference between "EMA above" and "EMA crosses above" is visible before any test runs. Templates such as "EMA 9/21 cross on XAUUSD 15M" and "Supertrend(10,3) on 1H" start from the conventional parameters discussed above. The chart's indicator list, built with the Advanced Charts library by TradingView and used under licence, is where to look at an indicator before writing it as a rule.
Trading involves a high risk of loss. DalRoti is a software tool and does not guarantee any profit. Decide your own risk and position size.
AI Generated