Backtesting pitfalls and how to read a backtest honestly
Overfitting, look-ahead bias, survivorship bias, missing costs and too few trades are the five ways a backtest flatters a rule. Here is what each one looks like and how to read a result without fooling yourself.
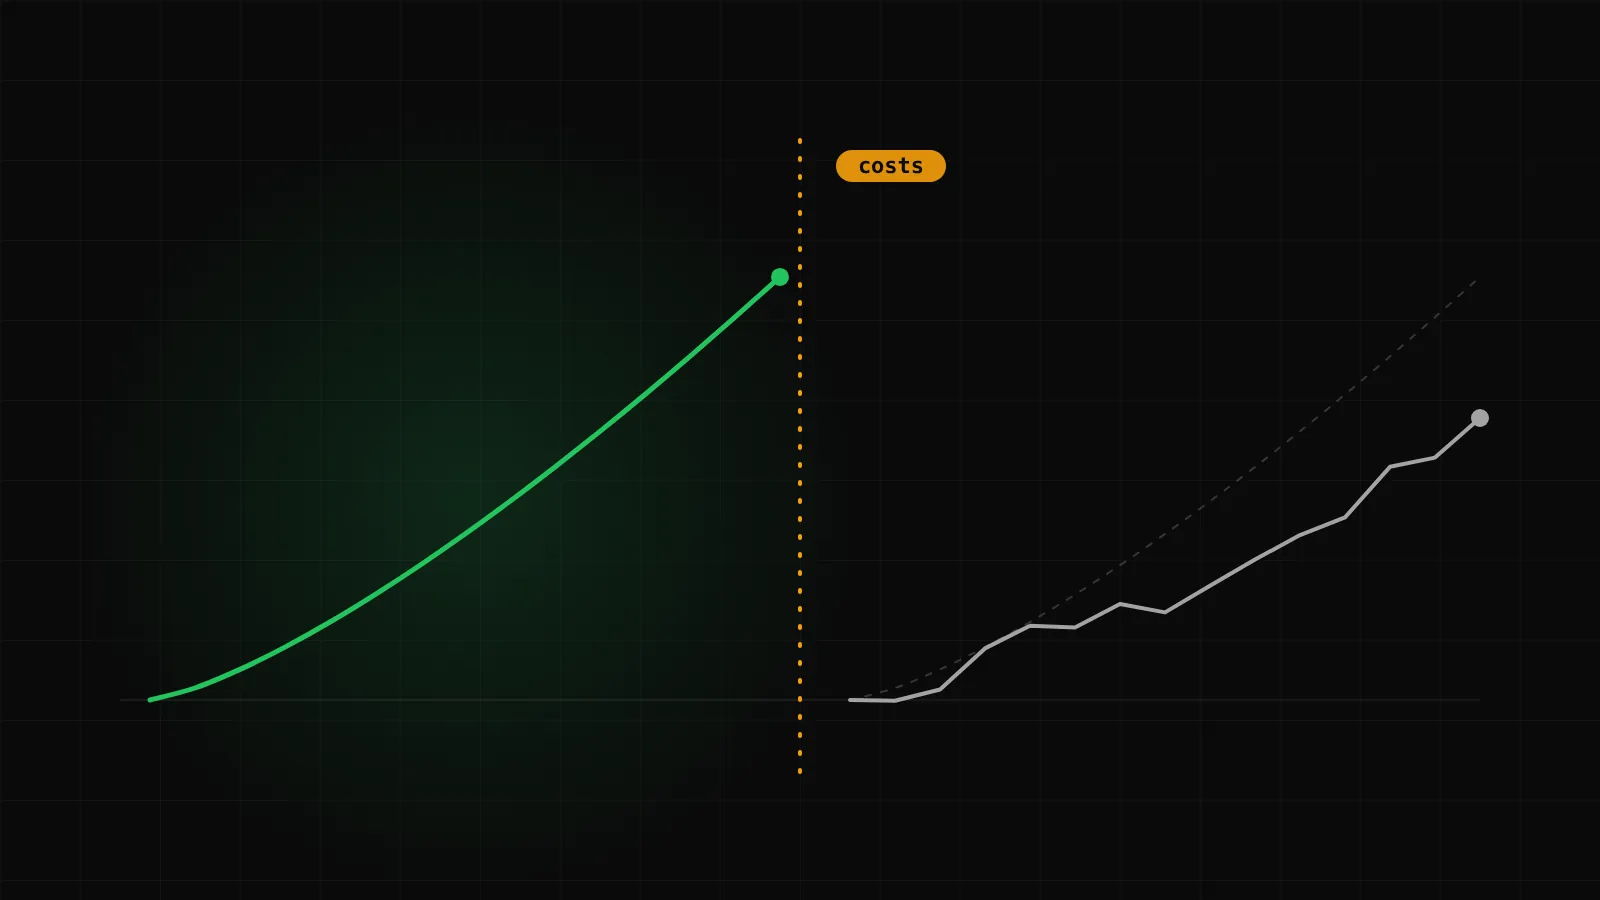
A backtest is a question asked of the past: if this rule had run over these months, what would the trade list have looked like? It is the cheapest test a trading idea can have, and it is also the easiest to misread. Almost every disappointing live strategy was, at some point, a backtest that looked fine.
This post goes through the five ways a backtest flatters a rule, and then gives a short checklist for reading one honestly. It is not an argument against backtesting. It is an argument for treating a backtest as evidence to be weighed rather than a verdict to be trusted.
What a backtest can and cannot tell you
A backtest can tell you whether a rule, as written, would have produced trades at all; how often; how large the losing streaks were; how long the capital would have spent drawn down; and whether the behaviour of the rule matches what you intended. Those are useful answers.
It cannot tell you what the rule will do next month. The past is one sample of what the market can do, and a rule tuned to that sample has been tuned to its accidents as much as to its structure. Keep that sentence in mind through everything that follows.
Overfitting: the rule that fits the past perfectly
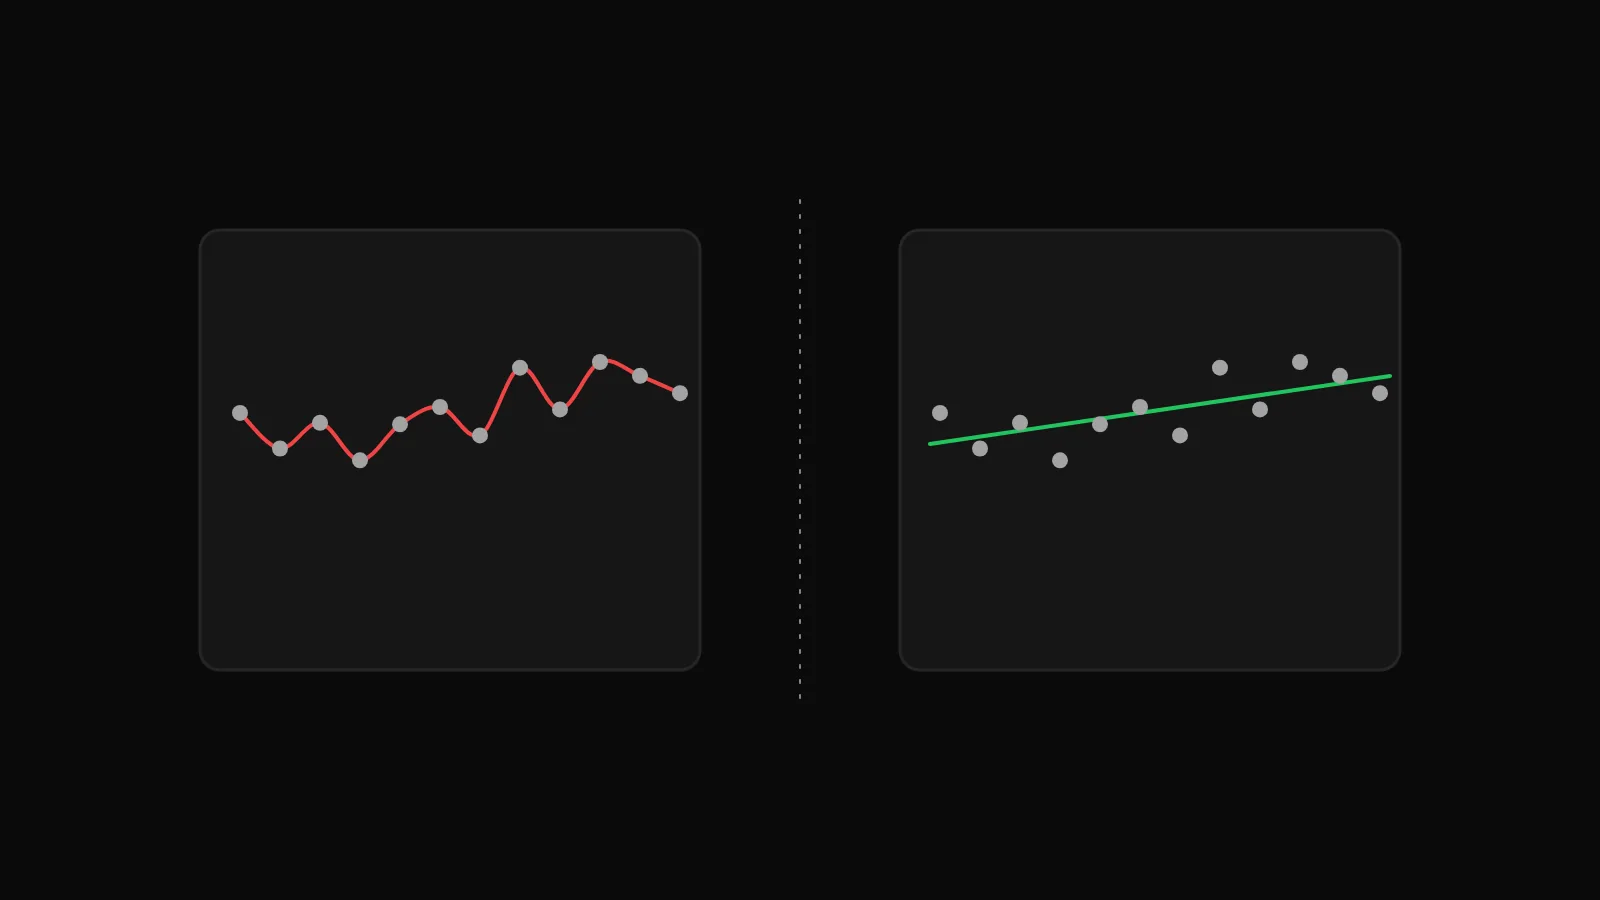
Overfitting is what happens when you adjust parameters until the result looks good. Change the EMA length from 20 to 21, the stop from 0.5 to 0.6 per cent, the entry window by fifteen minutes, run again, keep the best. Each adjustment is small and each is defensible. Together they produce a rule that matches the noise of the test period rather than anything repeatable.
Two signs give it away. The first is fragility: if changing a parameter by a small amount changes the result by a large amount, the rule is sitting on a lucky setting, not a robust one. The second is complexity: a rule with seven conditions, each added because it removed a particular losing trade, has been built backwards from the answer.
The defence is simple to state and hard to practise. Decide the rule before you look at the result. Test a range of parameters, not one. Prefer a rule that is merely acceptable across many settings to one that is excellent at exactly one.
Look-ahead bias: using tomorrow's data today
Look-ahead bias is any way in which the test uses information that would not have existed at the moment of the decision. The obvious form is a rule that refers to a candle's close before that candle has closed. The subtle forms are everywhere: an indicator calculated on daily data applied to intraday candles earlier in the same day; a filter that uses the session's high and low; an exit that assumes the stop and the target were both touched in one candle and quietly picks the one that helps.
Ask of every condition: at the exact moment this fires, was every number in it already known? If the test cannot answer, assume the worst. A backtest that resolves an ambiguous candle by assuming the stop was hit first is being pessimistic on purpose, and that is the right default.
Survivorship bias
Survivorship bias is testing on the instruments that are still around and ignoring the ones that are not. A rule tested on today's index constituents has been tested on the companies that did well enough to stay in the index. A rule tested on the three currency pairs you happen to like has been tested on the pairs you kept liking.
The same bias applies to strategies. If you tried twelve ideas and are now looking at the one that survived, the result of the survivor is not what it seems; it is the best of twelve draws. Keep a note of the ideas you discarded. The number of attempts is part of the evidence.
Ignoring costs and slippage
A backtest that fills every order at the bar price, with no spread, no commission and no slippage, is a test of the signal in a world that does not exist. For a rule that trades a few times a month, costs are a rounding error. For a rule that trades several times a day on a short timeframe, costs are often the whole difference between a result that looks acceptable and one that is not.
Slippage deserves its own sentence. A market order placed when a candle closes fills at the next available price, not the close. In a fast market that gap is wider, and it is wider exactly when the signal is most exciting. Set a realistic figure, and if you are unsure, set a pessimistic one.
Too few trades
A test with fifteen trades says almost nothing, however good the fifteen look. Small samples are dominated by a handful of outcomes; remove the two best trades and see what remains. A rule needs enough trades, across enough different market conditions, for the shape of its results to mean something. Fewer than a few dozen is noise. A long test period helps, but only if the rule actually traded through it.
How to read a backtest honestly
Read the assumptions before the result. How were fills timed? Was spread included? How were stop and target resolved inside one candle? How were gaps handled? If you cannot find these, the headline number has no meaning.
Look at the drawdown before the profit. Ask whether you would have kept the rule running at the bottom of its worst stretch. If the honest answer is no, the rest of the result would never have happened.
Count the trades and look at the distribution. How many were there? What does the result look like without the best few?
Check the equity curve for shape, not slope. Long flat stretches and sudden steps tell you where the result came from.
Re-run with worse costs and nearby parameters. If the result survives, you have learnt something. If it does not, you have learnt something more important.
Compare the backtest with a paper run over the same period before any real money is involved. A paper run uses real quotes and real timing; the gap between the two is your first measurement of how optimistic the test was.
How DalRoti helps
Backtests in DalRoti run on stored 1-minute history, built up to the strategy's timeframe, for up to a year. The result shows the equity curve, the trade list with the reason for each exit, the drawdown, win and loss counts and exposure. A "How this backtest was simulated" section lists the assumptions: how fills were timed, whether spread was applied, how a stop and target inside the same 1-minute bar were resolved (the stop is assumed first when it is ambiguous), how gaps were treated and how long indicators needed to warm up. That section is the first thing to read.
Cost settings are explicit: fill timing, a cost preset for your broker, slippage, spread and commission. Two finished runs can be compared side by side, which makes the "nearby parameters" test quick. After a backtest, a paper run on the DalRoti Paper account shows a signal match against the backtest, so the optimism of the test is measured rather than guessed. A backtest is not a prediction, and the help article on why backtest, paper and live results differ says so plainly.
Trading involves a high risk of loss. DalRoti is a software tool and does not guarantee any profit. Decide your own risk and position size.
AI Generated